- 31 Oct 2023
- 2 Minutes to read
- Print
- DarkLight
Threat Intelligence
- Updated on 31 Oct 2023
- 2 Minutes to read
- Print
- DarkLight
Threat Intelligence continuously monitors samples of network traffic passing through Edge iNodes for anomalies and will report any vulnerabilities found in the traffic pattern. You can enable Threat Intelligence on iNodes and clusters, set up notifications, and review the findings in the Secure Edge Portal.
Configure Threat Intelligence
Follow these steps to configure Threat Intelligence for an iNode or cluster:
- From the left menu of the View portal, select All iNodes or Clusters, respectively, and then select the specific iNode or cluster.
- On the Manage iNode or Manage Cluster drop-down menu (top-right), select Edit > Advanced Settings.
- Set the Threat Intelligence toggle switch to On.
- Select the desired sampling frequency, which is the rate at which network traffic samples are taken from the iNode. You can choose any value between the range of 1 in every 5000 packets (a high sampling frequency) to 1 in every 100000 packets (a lower sampling frequency).
- Select Update.
The following screenshot shows Threat Intelligence configuration at the iNode level.
.png)
This next screenshot shows Threat Intelligence configuration at the cluster level.
.png)
Reviewing Threat Intelligence findings
Once Threat Intelligence is enabled, you can review findings in threat overview charts and detailed threat dashboards.
Threats overview
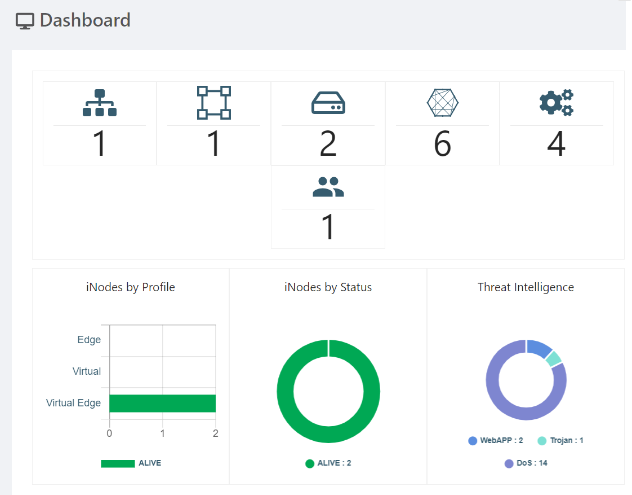
The threats overview chart shows a summary of threats found in the past 7 days, by count. You can find this chart on the iNode detail page and also the portal dashboard for your organization.
The threat overview chart on the iNode detail page shows the top three threats found in the past 7 days, by count, for that iNode.
.png)
The threat overview chart on your organization's dashboard shows the top three threats found in the past 7 days, by count, across all iNodes where Threat Intelligence is enabled. It also includes threats detected on child organizations.

Threats Dashboard
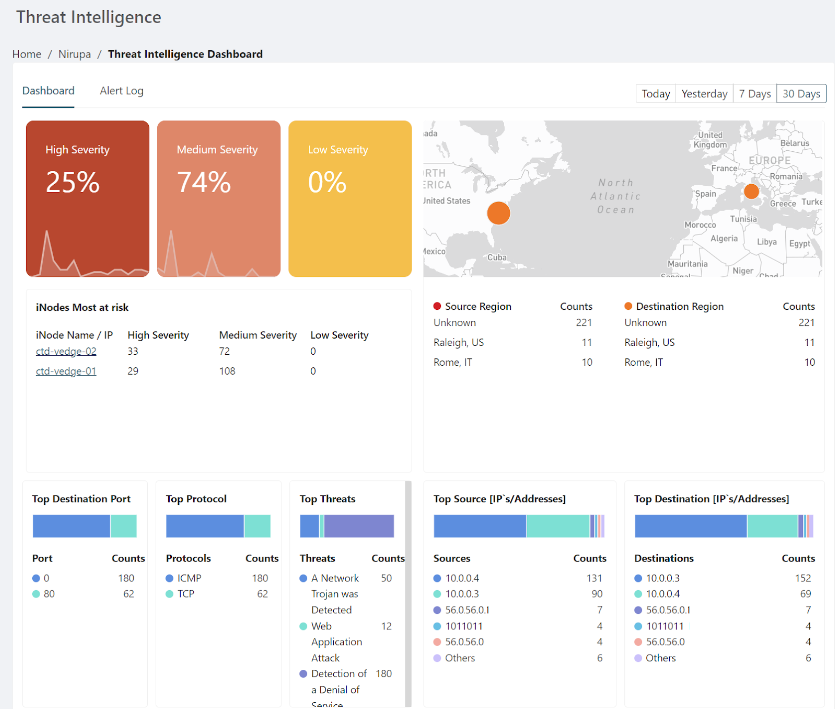
The threats dashboard is available at either the iNode level or at the organization level, and gives details on threats detected across all applicable iNodes in the organization.
To open the threats dashboard, click on the threat overview chart on either the iNode details page or your organization's dashboard. The following example shows a threats dashboard at the organization level.

The threats dashboard renders charts that group threats based on different network parameters and also by severity. Threat severity is categorized as follows:
- High: Threats that carry the highest risk to an organization, such as attempted or successful access to admin resources, a web application attack, or executable code.
- Medium: Threats with significant risk to an organization, such as leaked data, suspicious user login attempts, or an unusual filename.
- Low: Threats that might pose a risk to an organization, such as a detected network scan or suspicious traffic.
The severity percentage reflects the percentage of each severity type against the total number of issues. For example, if an inspection of 500 packets identifies 80 problematic packets, and 40 of those are medium severity, the dashboard would show 50% medium severity.
If there are no threats detected in the specified time period (top-right selection), the threats dashboard will display statistics information.
.png)
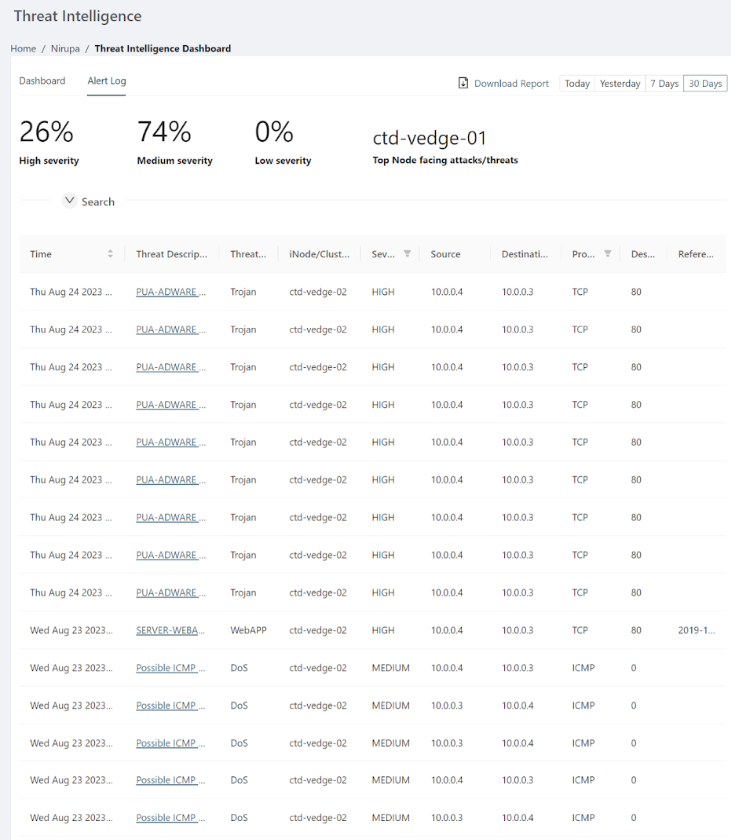
The dashboard includes an alert log where you can search/filter across threats detected in the specified period and download reports (CSV).

Configure alerts
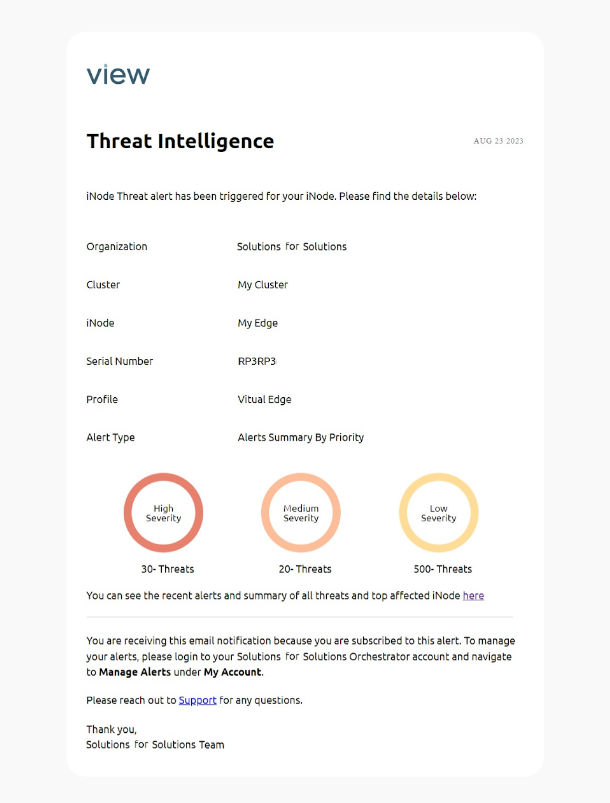
You can configure alerts in the Secure Edge Portal and subscribe to notifications about threat information via email or webhook. Once configured, you will receive two types of alert notifications:
- Instant notifications for high-priority threats detected in the iNode
- Daily notifications (at 6:00PM EDT/EST) with a threat count summary for each iNode
The following image shows an example email notification.

For detailed instructions, see Using Alerts.

