- 12 Apr 2023
- 1 Minute to read
- Print
- DarkLight
Viewing Service Logs
- Updated on 12 Apr 2023
- 1 Minute to read
- Print
- DarkLight
You can view service logs from the Edge iNode details page.
Accessing service logs
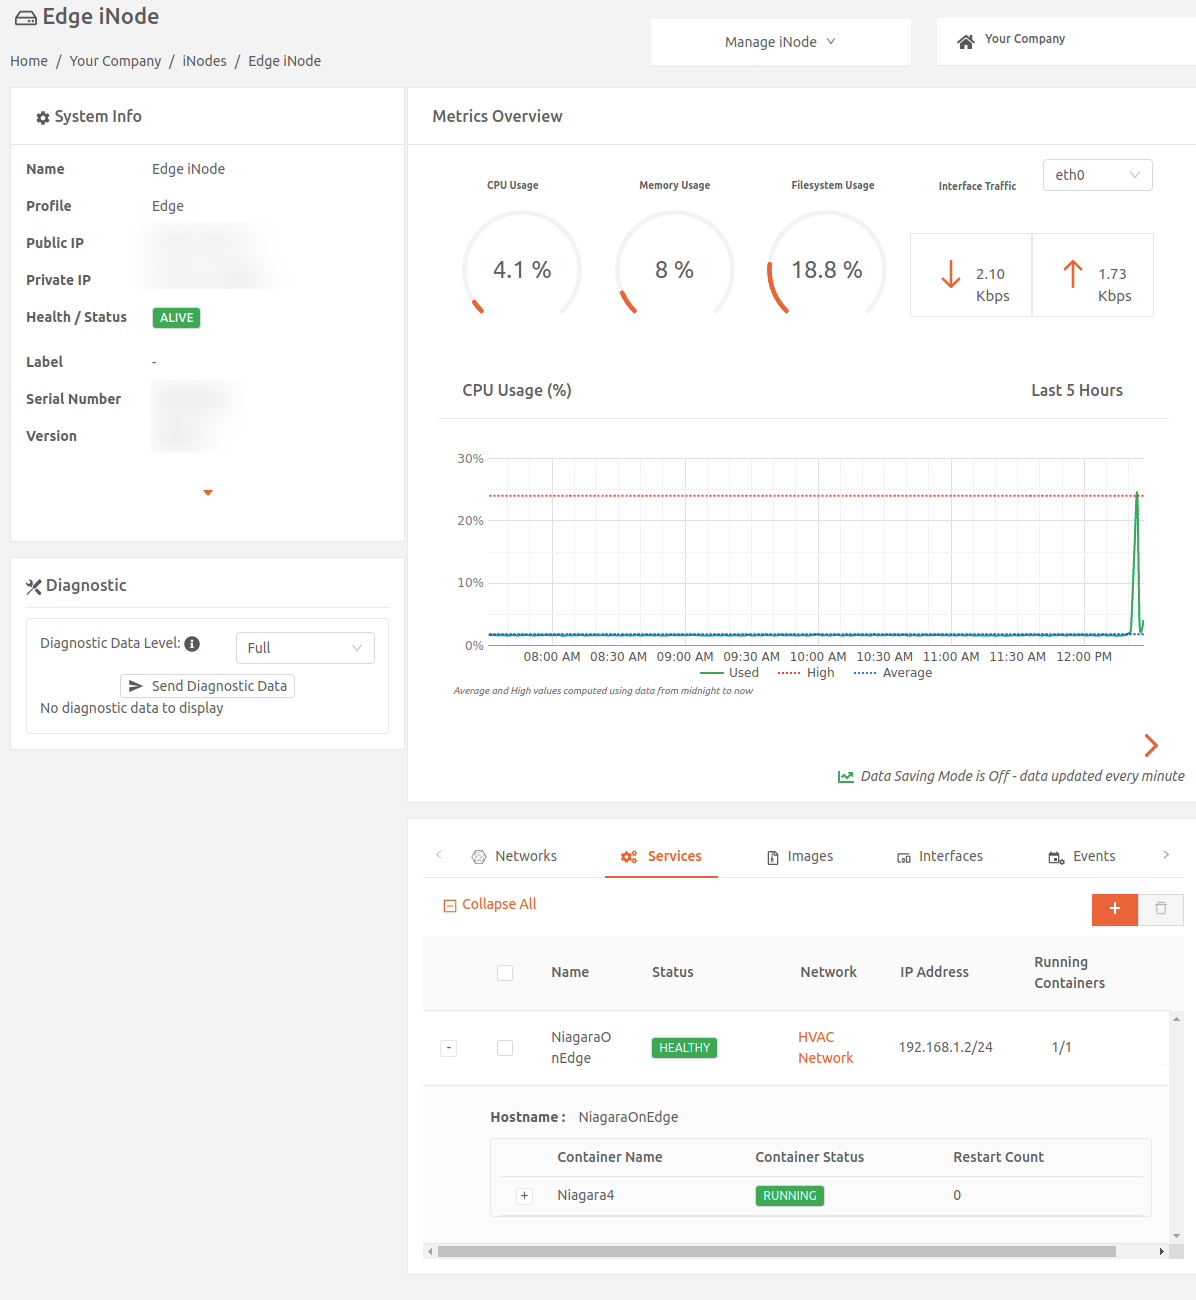
- From the iNodes page in Secure Edge Portal, select the name of the Edge iNode to display the iNode details page.

- In the Services tab, select the Service Logs icon for the service.

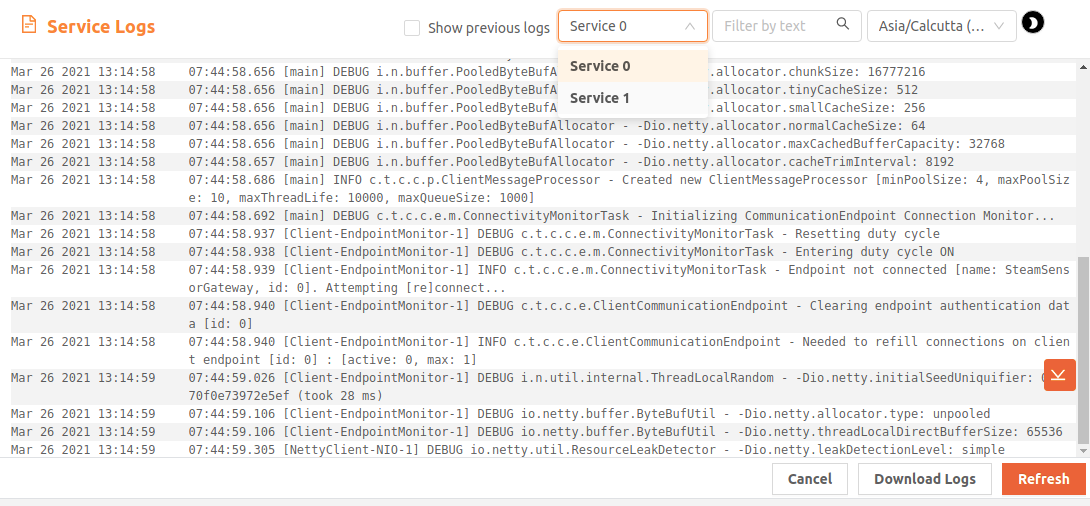
- This displays the Service Logs window:

By default, the service logs window displays logs from the first container in the service. Use the dropdown menu to filter by service container or use Filter by text to view logs containing specific text.
In case your service restarts and you want to check the logs of the previous run, select the Show previous logs checkbox. This displays the logs of the previous instance of the container.
To jump to the oldest logs, use Get oldest logs, an icon that appears near the scroll bar when you’re scrolling up. Jump to the newest logs by selecting the Get newest logs, which appears when you’re scrolling down.
By default, logs are displayed in a light background. Toggle between dark/light modes using the sun/moon icon.
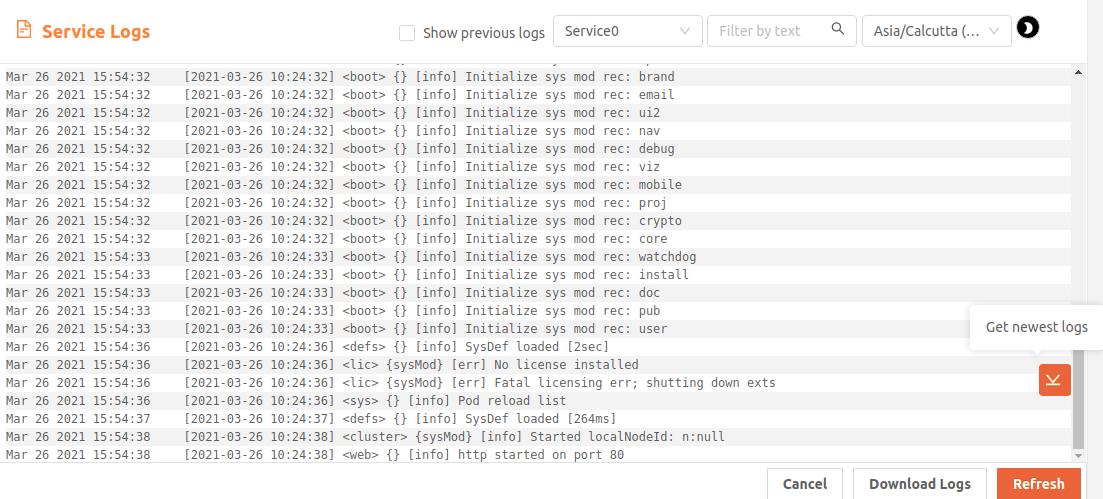
Service logs for all Edge iNodes show the timestamp for each log line according to your account timezone setting. The default is the local timezone according to your browser. To view the logs according to a different timezone, use the timezone drop-down on the top right. To view or change your account timezone setting, on the left menu, select My Account > My Profile.
To download the logs file, select Download Logs.
Select Refresh to refresh the log file.


